OEE Manufacturing.
Availability, performance, and quality: tracing production losses from the plant overview to individual machines.
01 / Why
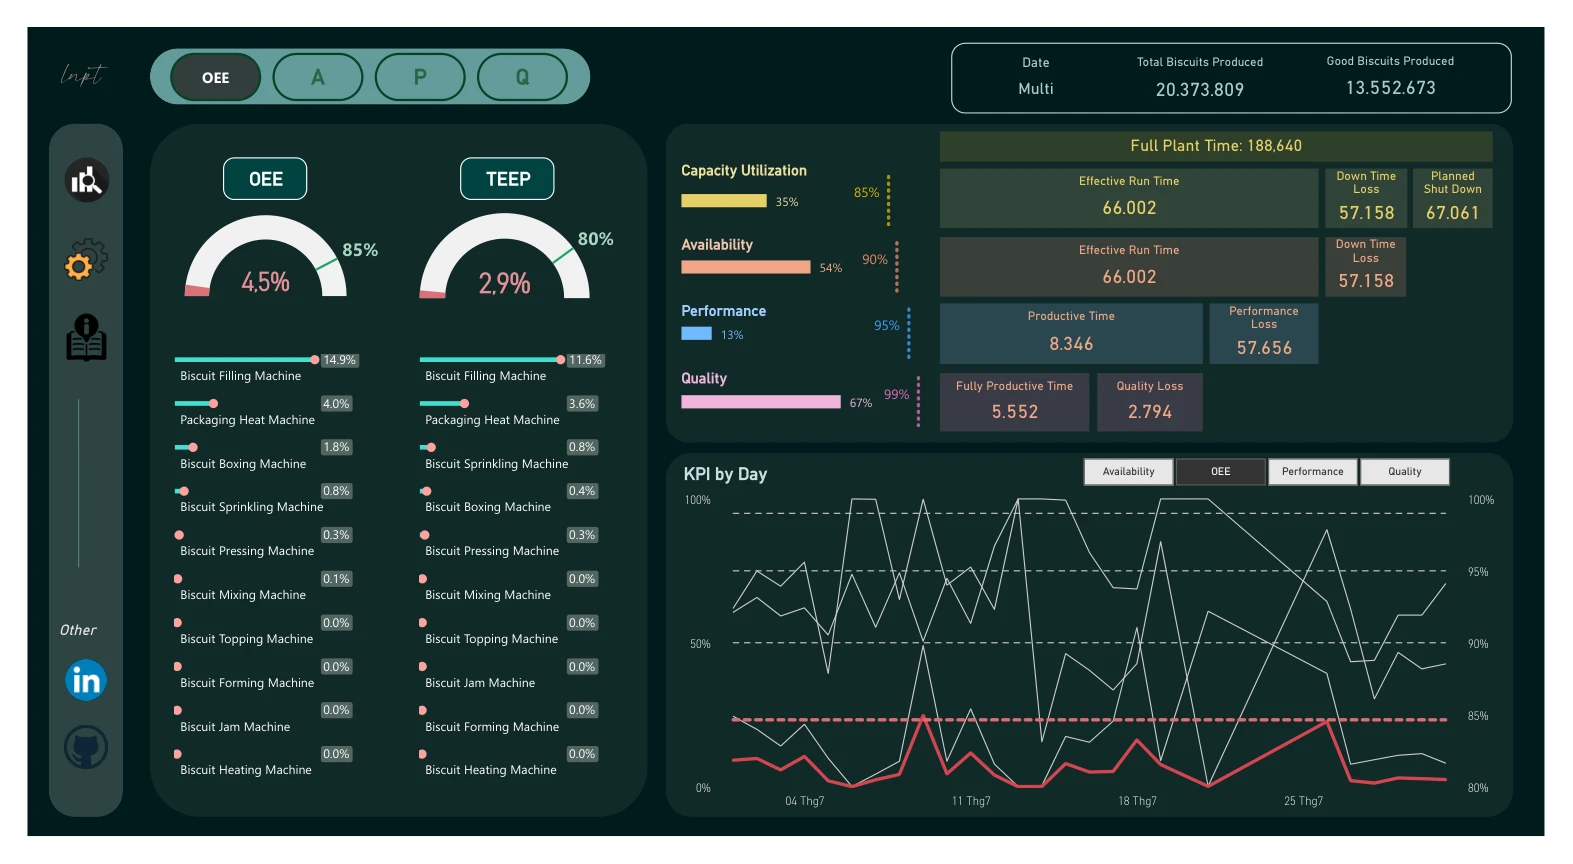
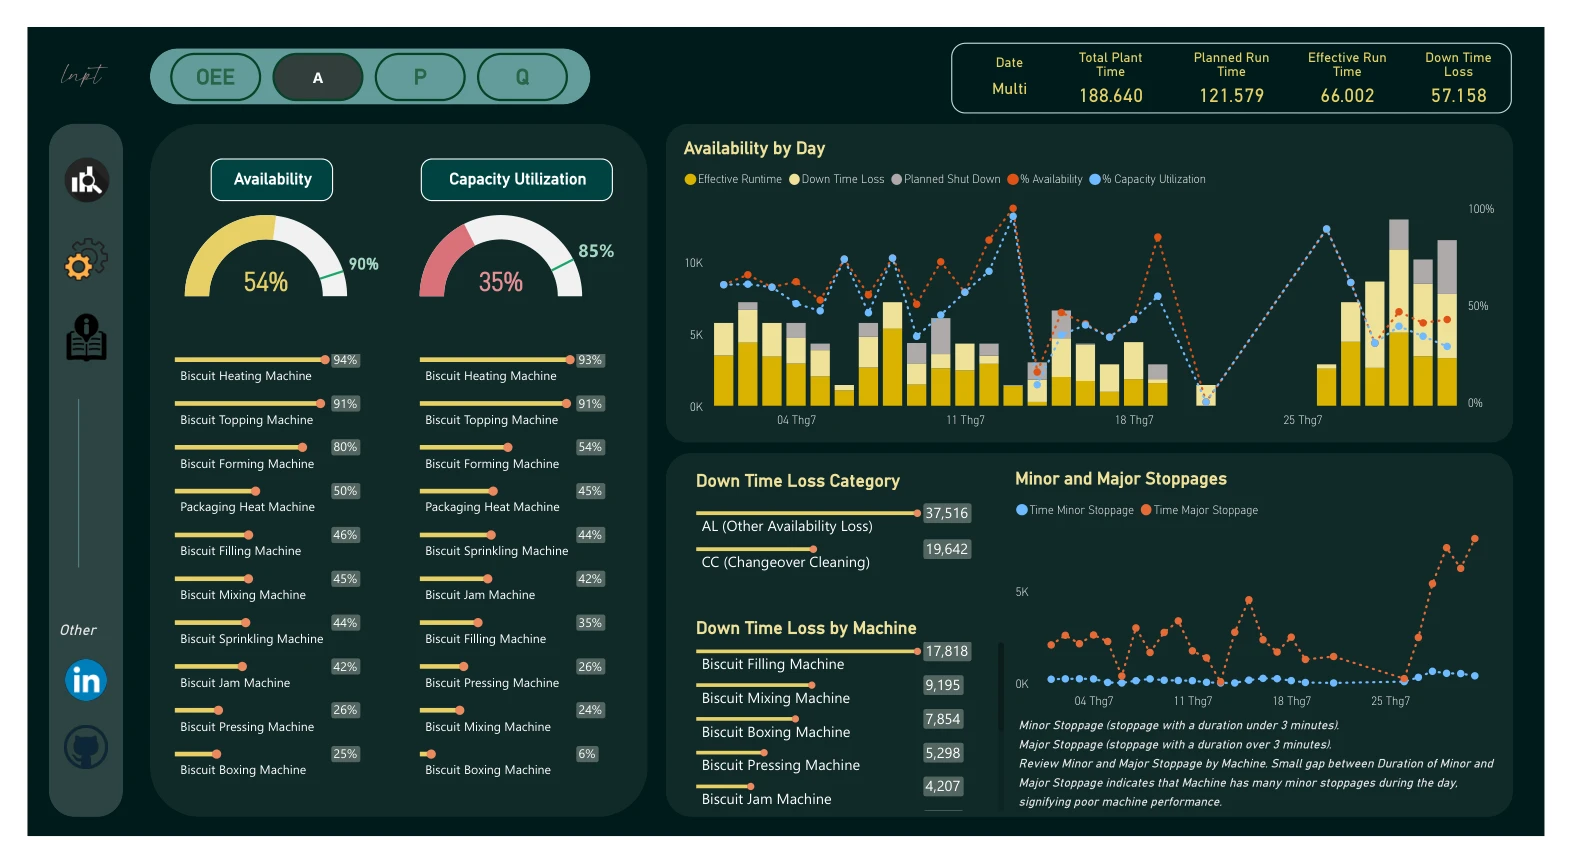
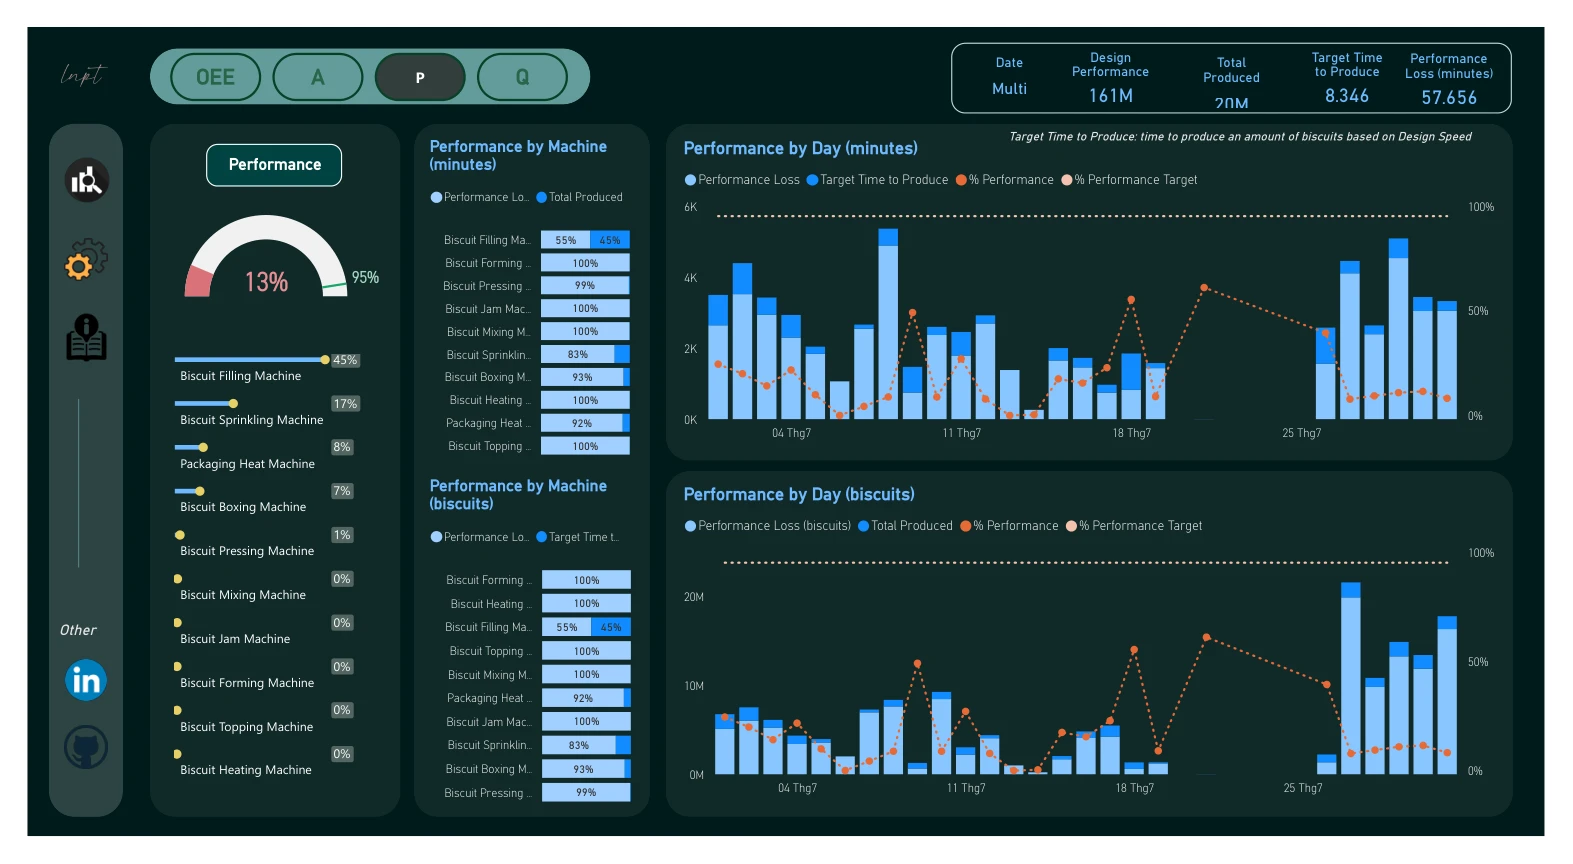
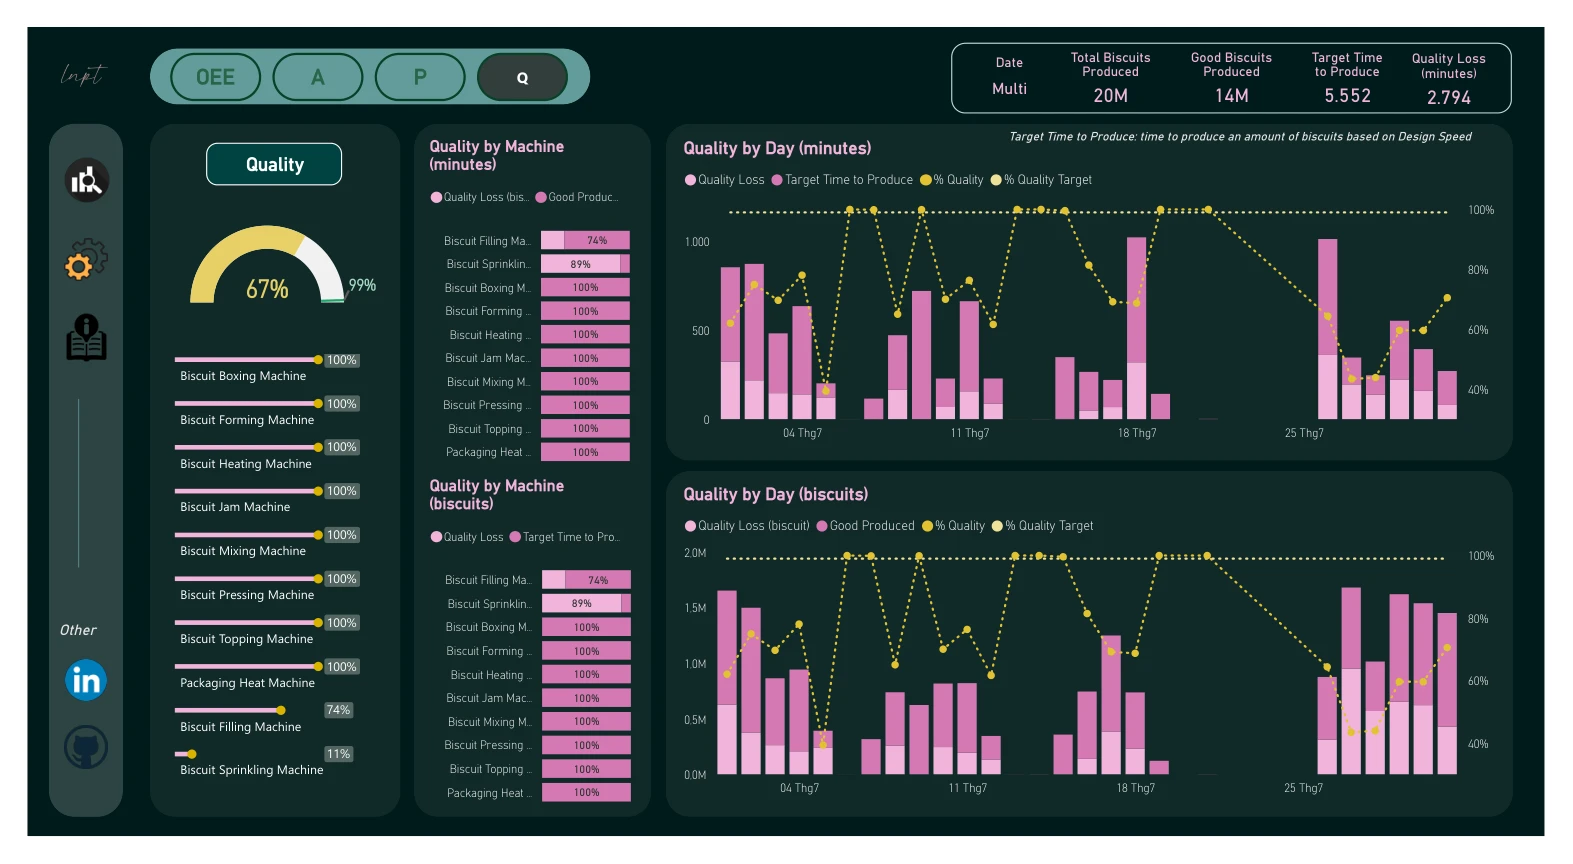
An overall production figure does not explain where effective run time is lost. This dashboard separates availability, performance, and quality to make those losses visible.
02 / Approach
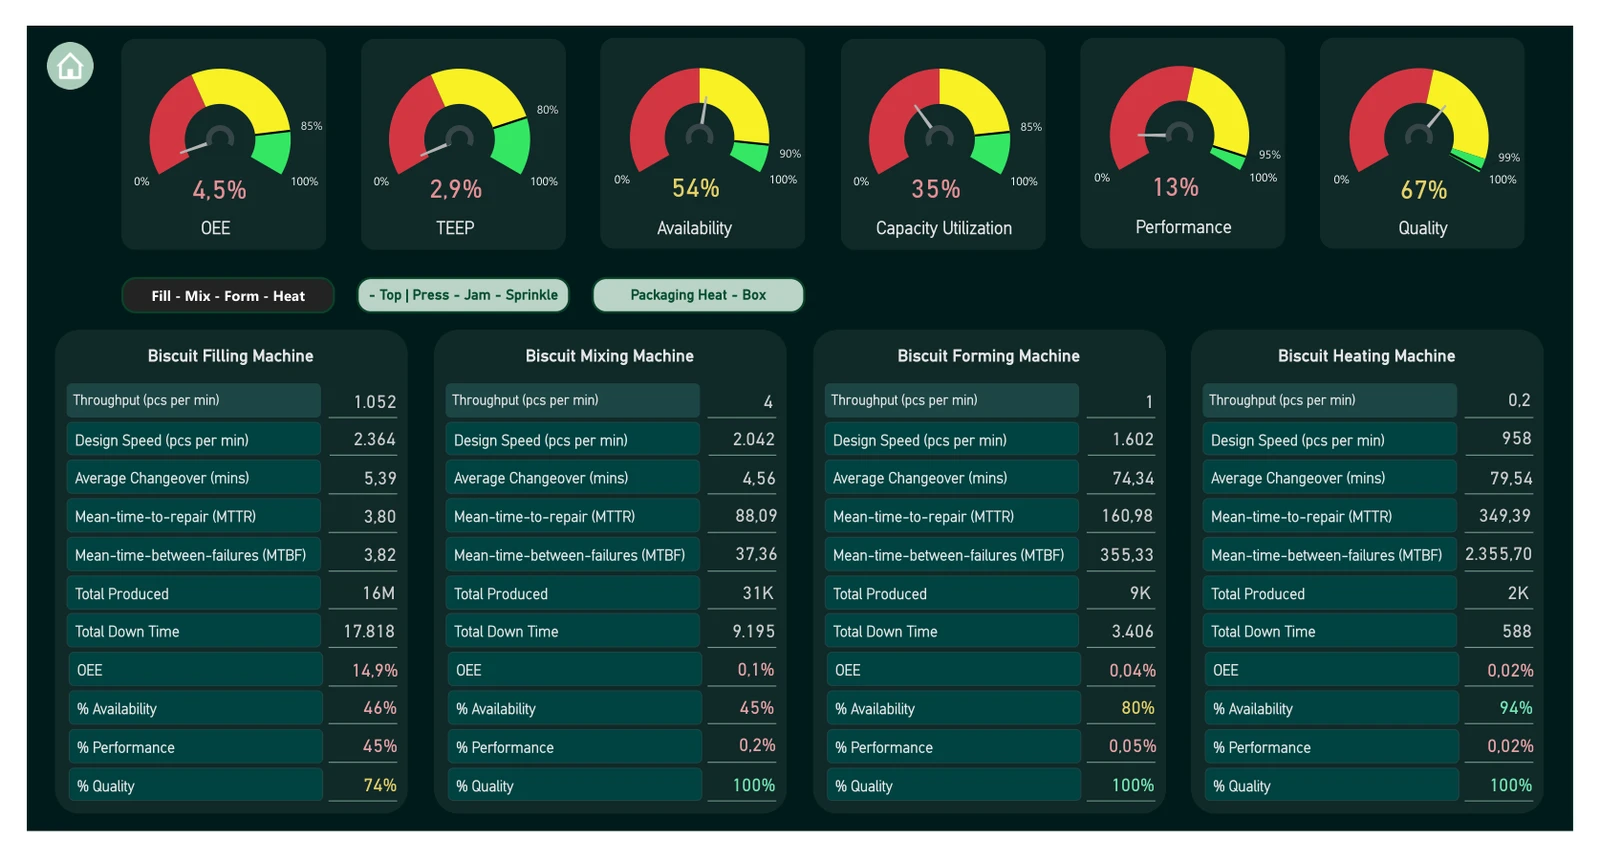
Connect a plant-level OEE and TEEP overview to separate availability, performance, and quality views. Compare daily trends and machine-level indicators, including stoppages and capacity utilization.
03 / The build
A five-page Power BI report covering production efficiency, downtime, performance losses, quality losses, and machine-level details. The supplied report is available below as a static PDF.
04 / Outcome & reflection
The report presents multiple paths into the production data rather than a single aggregate score. Its displayed values describe the report dataset; they are not claims of efficiency improvements delivered by this project.